What the faulty query reported
Bike revenue fell
−$54.32M
$212.38M → $158.06M
H1 2024 → H1 2025 · An apparent decline.
EntailDB
Ask a question in plain language. Explore the answer, follow up, and inspect the data behind it. EntailDB gives business users more independence and technical teams the evidence to check the results.
A failure worth catching
In a product exercise using sample data, a faulty AI-generated query counted the same sale repeatedly—and turned growth into an apparent loss. Here is what happened to bike revenue.
What the faulty query reported
−$54.32M
$212.38M → $158.06M
H1 2024 → H1 2025 · An apparent decline.
What the corrected calculation showed
+$2.15M
$15.26M → $17.41M
H1 2024 → H1 2025 · Revenue actually increased.
The mistake, made visible
Imagine one order containing three bike items. The assistant added the whole order total once for every item, instead of adding each item's revenue.
The query ran successfully. It just counted the same money three times. When orders contain different numbers of items, this can even reverse the apparent direction of growth.
| Item | Item revenue | Whole-order total |
|---|---|---|
| Bike A | $100 | $600 |
| Bike B | $200 | $600 |
| Bike C | $300 | $600 |
| Sum | $600 Correct | $1,800 Wrong |
EntailDB checks for this repeated-total pattern and adds its finding before the assistant's final answer, giving the assistant an opportunity to revise its calculation. For category revenue, the corrected query adds the revenue from each item, rather than the repeated order totals.
The original question was: “Comparing H1 2025 with H1 2024, which product category declined most in revenue?” Bikes was one of four categories in that result. Components remained the category with the largest decline, but the faulty query overstated that decline by nearly 68× and incorrectly showed declines in the other three categories.
| Category | H1 2024 | H1 2025 | Change |
|---|---|---|---|
| Components | $200.95M | $122.00M | −$78.95M |
| Clothing | $114.97M | $64.81M | −$50.16M |
| Accessories | $49.31M | $46.26M | −$3.06M |
| Bikes | $212.38M | $158.06M | −$54.32M |
| Category | H1 2024 | H1 2025 | Change |
|---|---|---|---|
| Components | $2.83M | $1.67M | −$1.16M |
| Clothing | $0.44M | $0.46M | +$0.02M |
| Accessories | $0.14M | $0.47M | +$0.33M |
| Bikes | $15.26M | $17.41M | +$2.15M |
Sample data from the product exercise. Values are rounded; changes were calculated before rounding.
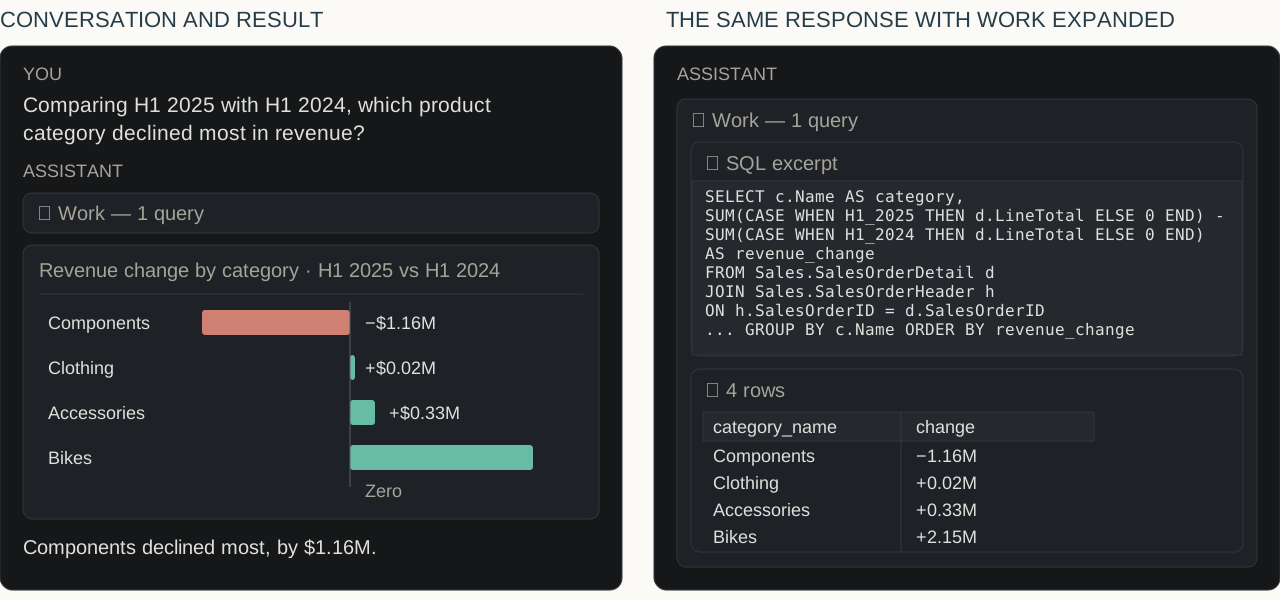
Ask about sales, operations, or other connected business data without writing SQL for each question. Refine the analysis through follow-up questions as new patterns emerge.
Expand the Work panel to inspect the SQL queries and returned rows behind an answer. Ask for a chart or a different chart type in the conversation. Charts use returned data, and limited previews are identified.
EntailDB builds and refreshes a profile of database structures and relationships. Checks address known traps, including joins that inflate totals. Important conclusions remain subject to review against the evidence and your business definitions.
Read-only query controls restrict database operations. A read-only database account adds protection at the source. Connection permissions determine which users can access each database through the application.
An extensible connector architecture supports additional database systems as needed. EntailDB runs independently with a configured local or cloud model. Integration with Ardua AI adds policy enforcement over model selection and data sent to models.